Measuring the economy’s metabolism
In order to contribute to the sustainable transition of the economy, politicians and other actors need to be aware of how the metabolic process of the economy is going and how different policies affect it. In environmental and energy policy, there is a tradition of focusing on many different issues separately: the state of the aquatic environment, the use of hazardous chemicals, the reduction of CO2 emissions, etc. It is essential to keep track of the individual areas and prepare specific policies, but this does not give a general overview of whether progress is being made, or otherwise, at the macro level. For example, when attempting to determine whether the Danish economy is ‘healthy’, there is a tradition of using economic indicators: GDP growth; balance of payments; full employment; an appropriate increase in the level of prices, etc. In particular, there is much focus on the increase in GDP as an indicator of progress. However, from an ecological economics point of view, there are a lot of problems with GDP as an indicator because it does not say anything relevant about how it is going with the sustainable transition or welfare in the society. GDP is primarily a measure of the level of activity in the formal economy: the more that is sold on markets or is made available by the public sector, the higher the GDP. These activities are included in GDP, even if they are the result of the exploitation of resources that can not be replaced. GDP also increases when the arrangement of society creates problems, such as traffic accidents, diseases or pollution, which give rise to economic activity. When the activity itself is central, the advantages and disadvantages are added together, and this is not suitable as a management tool for sustainable transition.
Biophysical indicators
In the field of ecological economics, an important task has been the development of indicators that are better than GDP at demonstrating whether progress in a biophysical sense is being made or not. As previously mentioned, this is difficult to determine by looking at how it is going with solving the long list of specific environmental problems. Instead, you can look at the size of the total input that enters the society’s metabolic organism: How much energy and materials do we use and how large an area do we take up? The idea is that the total inputs can be used as indicators of how large society’s metabolic organism has become in relation to the biosphere, and that this size, which is also called the scale of the economy, is important for the extent of the many different specific problems. In addition to measuring input, it is also important to monitor carbon emissions on the output side of the metabolic organism because it is so crucial in terms of the climate problem. There follows some examples of input indicators that supplement each other, but also partially overlap. Initially, the focus is on how the metabolism can be measured globally. Then measurements for different parts of the global economy are included.
MFA
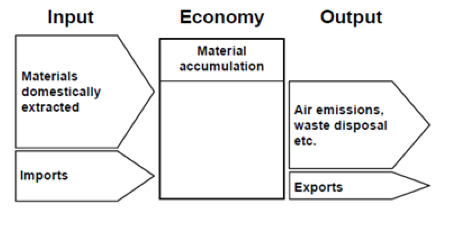
One of the methods for measuring the metabolism of the economy consists of calculating the weight measured in tonnes of the amount of materials supplied to the economy over the course of one year. The method is called Material Flow Accounting (MFA). As the name suggests, it is the flows of materials that are in focus, but at the same time, it also calculates how much material accumulates in the economy, for example, in the form of buildings and roads. In order to be consistent, the accounts must fulfil the material balance principle: The amount of materials added to the economy in a given year must correspond to the sum of the materials that accumulate in the economy and the materials that leave it in the form of waste and emissions in the same year. In order to set up such accounts, it is necessary to establish some system boundaries. For example, it is said that materials have left the economy when society has lost control of them as happens, e.g. when fertilisers are spread on fields.
The materials are divided into four main groups: biomass, construction materials, fossil fuels and metals and industrial minerals. Water is not included because it would dominate the picture to such an extent that other developmental trends would be obscured (in order to comply with the material balance principle, one must, therefore, account for biomass as dry matter – otherwise water vapour would have to be included on the emissions side). The figures below show how the material flows for the global economy changed from 1900 to 2005. In the first half of the 20th century, growth was modest, while the three decades after the World War II were marked by high growth (the great acceleration). Growth became somewhat lower from the early 1970s until a new growth period began in the early 2000s. The economic crisis, which began in 2008, is not included in the figures, but it led to a slowdown in growth. Over the period as a whole, a metabolic shift occurred as the share of material flows that is biomass decreased from 75% to 40%. Fossil fuels gained much greater weight and there was a dramatic increase in the use of construction materials. In a developed economy such as Denmark’s, one might think that there was no need for such expansion, but the annual net accumulation has been calculated at 11 tonnes per person/year for 1990.
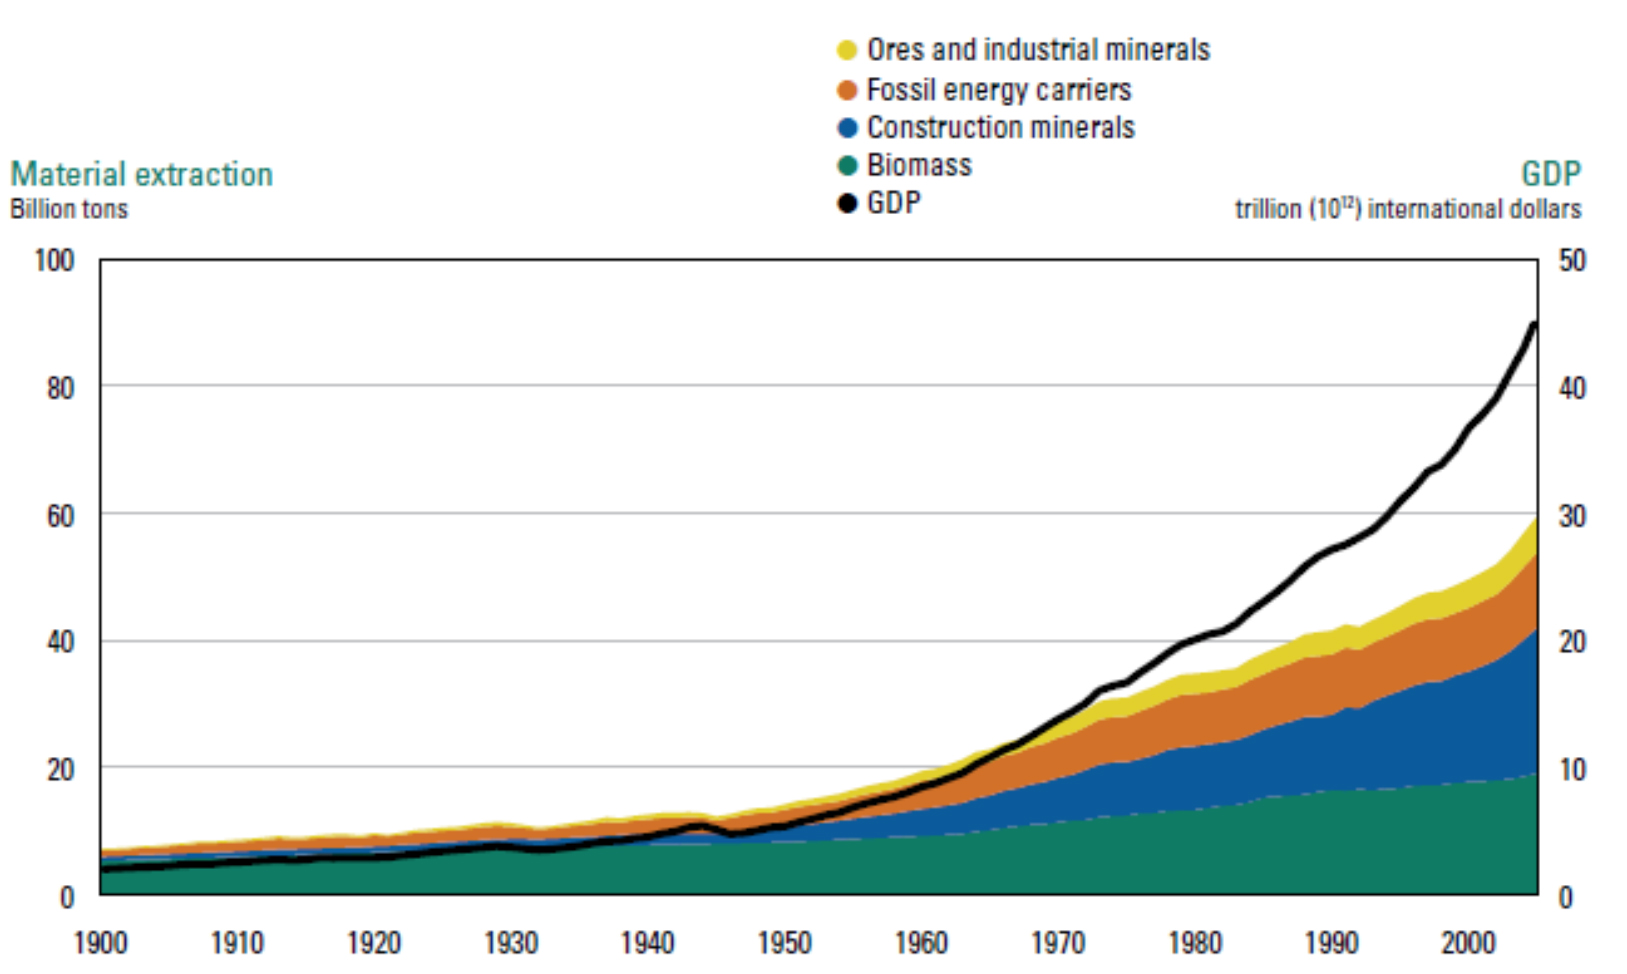
The data behind the figures only relate to the used material flows, i.e. the materials that have obtained the status of products in the economy. In addition, approximately the same amount of materials has been moved around, but has not been used. These so-called hidden flows include, for example, overburden and excavated material in connection with mining, which can also have significant environmental effects.
Energy
Another method of measuring the metabolism of the economy focuses on calculating energy consumption. Energy is included in material flow analyses as the weight of the fossil fuels and biomass that is used for energy purposes, but several other energy sources, such as hydropower, nuclear power, wind power, solar and geothermal energy, fall outside. Due to the key role of energy in the economy, it is interesting to calculate the total input of primary energy, i.e. the energy that is embedded in natural resources before they are converted to energy carriers such as petrol or electricity. Primary energy resources include, for example, oil, coal, uranium, sunlight, wind, timber and flowing water in rivers. Energy resources can be combined because, in principle, they can all be expressed in the same unit of measurement – the joule. For fossil energy sources, there is consensus regarding the calculation of the energy contained in a given amount of the energy source (for example, the energy content of 1 ton of oil or coal), but for other energy sources, such as renewable energy, it is not that simple. For wind power, for example, you can either choose to set the primary energy equivalent to the energy obtained from the energy source in the form of electricity, or you can assume that wind power involves an energy loss during conversion corresponding to fossil energy so that the amount of primary energy from wind power is estimated to be a significantly larger figure.
During the period 1900 to 2005, total primary energy consumption on a global scale has increased by a factor of 11, which is slightly more than the increase in material consumption, which, according to Krausmann and others, increased by a factor of 8.4. If you include the quality of the energy consumption, growth was even greater. When the different energy sources are combined on the basis of their potential conversion to heat, the fact that there is greater loss during conversion to energy carriers for some energy sources than for others is not taken into account, nor is the fact that some energy sources are suitable for use as work energy (e.g. to power machines), while others can only be converted to heat. Over time, there has been a significant improvement in the efficiency of converting energy sources into energy carriers. Furthermore, the relatively high growth in fossil fuel use compared to biomass has increased the consumption of labour energy significantly more than the consumption of energy in general.
HANPP
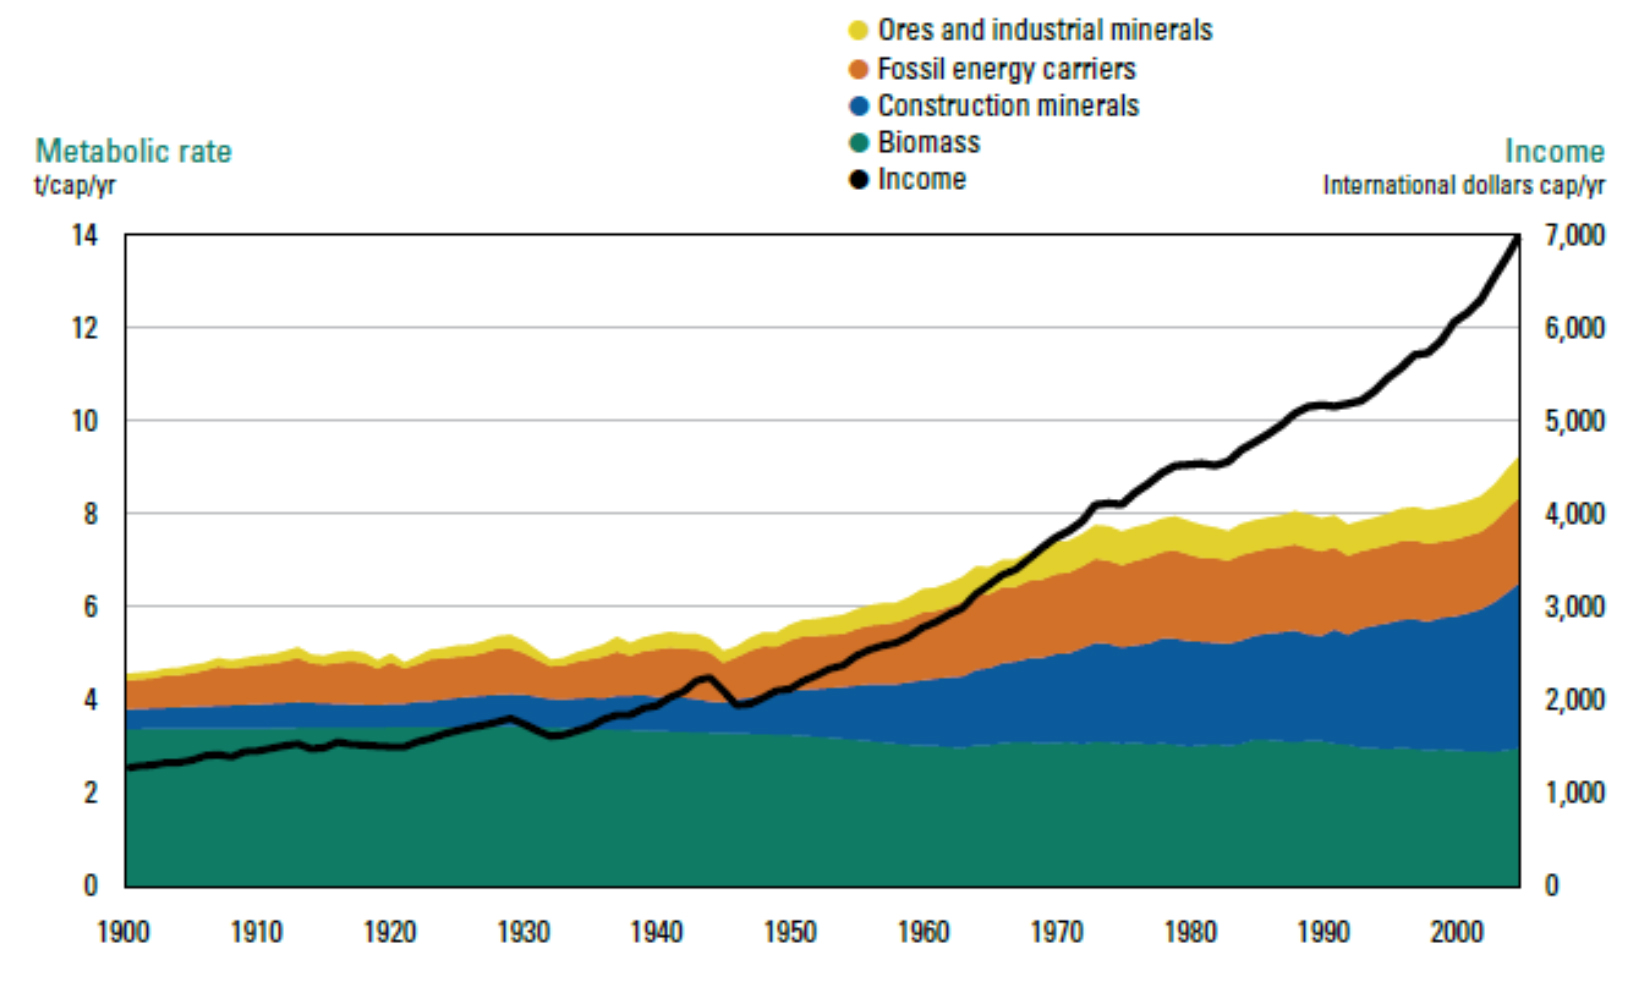
The material flow analyses include biomass, but it is also the starting point for a specific measure. Ultimately, all plants and animals (including humans) live from the production of biomass that plants produce by photosynthesis. The amount of biomass that the plants do not exploit for their own survival is called Net Primary Production (NPP). The annual NPP is measured in kilograms of dry matter (or in joule or carbon – the result is the same) and it is available to all animal species through the food chain. To get an idea of how much of the biosphere people ‘take up’, how great a share of NPP humans appropriate is calculated. This share is called Human Appropriation of Net Primary Production (HANPP). It has been estimated that, in 2005, HANPP amounted to about 25% of the land-based photosynthesis (biomass production in seas and watercourses is not included), cf. https://www.ncbi.nlm.nih.gov/pmc/articles/PMC3690849/. Considering how many species need the NPP, 25% is a very large number for a single species – and the greater the number becomes, the more the living conditions of other species deteriorate – as do the conditions for humans in the long term because ecosystems are disturbed.
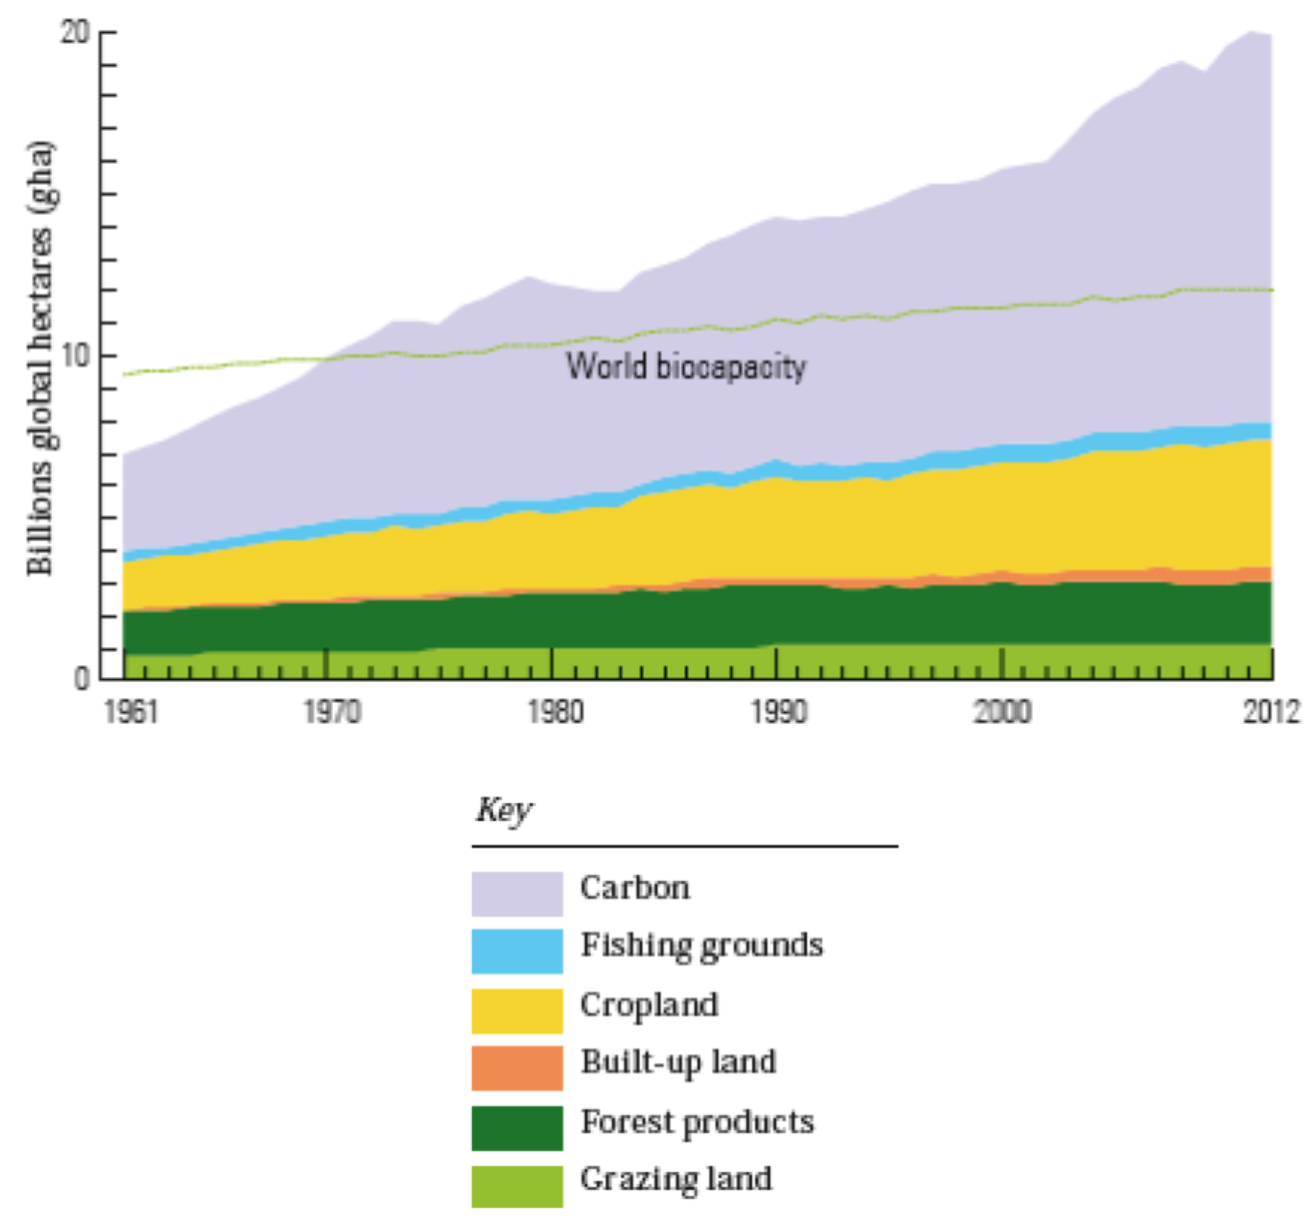
Ecological footprint
In contrast to material flow analysis, the focus of the ecological footprint is on land use. Humans’ ecological footprint is defined as the area needed to produce our total annual consumption of goods and services and to neutralise the effect of our greenhouse gas emissions in the same year. For the annual consumption, humans primarily appropriate areas for the cultivation of biomass, which is used for food either directly or indirectly through feed for livestock. In addition, biomass is used as fuel and for the production of, e.g. housing, furniture and paper. Area is also appropriated through construction and infrastructure. As well as the actual use of land, so-called virtual land use is included, which is connected to the use of fossil fuels. The method calculates how large an area it would be necessary to plant with trees in order to absorb and neutralise the carbon emissions resulting from the annual fossil fuel consumption. One may say that fossil fuels constitute a kind of ‘saved area’, which today allows more land to be used than is currently available on the planet. It is estimated that today we use 1.5 Earths.
Part of the global metabolism
Above, the different measures for metabolism are explained based on the global economy as a whole. However, it becomes a bit more complicated, for example, to measure the metabolism at the national or regional level, or if you want to look at the metabolism that is associated with a single individual’s consumption. In this case, it is necessary to look at the flows of energy and materials internally in the world economy’s metabolic organism, and not just input and output relative to the biosphere. For example, if you want to measure an individual’s energy consumption, it is not enough to look at the direct energy consumption in the form of electricity, petrol, heating, etc. It is also necessary to include the indirect energy consumption used to produce and transport the other goods and services that the individual has purchased. Behind this there is usually a long production chain. In principle, it is possible to analyse each of these production chains, but it is far too complicated when analysing the total consumption for one individual or group. Instead, input-output tables are used that show how much different sectors of the economy supply to each other in terms of value. For example, it is possible to calculate how much production different sectors need to supply to make possible 100 DKK worth of consumption of a particular product group such as IT equipment or pork. This calculation can then be combined with data on energy consumption in the different sectors so that you can estimate the total energy consumption associated with 100 DKK consumption of IT equipment or pork. In addition to the value-based input-output tables, there are also physical input-output tables that show how much the different sectors supply to each other by weight.
This type of data on the production chains makes it possible to calculate the metabolism at the national level, for a city or for a household. At the national level, for example, it is interesting to see how many resources a country’s population appropriate when imports and exports are taken into account. For example, if you look at material flows, not only does the weight of the products that cross the border in connection with trade need to be counted, but also the weight of the resources that were involved in the production and transportation of the product before it crossed the border. The same applies when calculating ‘embodied HANPP’, i.e. the amount of biomass that has been used to produce, for example, a food product.
From the 1980s up to the financial crisis in 2008, there was a sharp increase in international trade, both in money and biophysical terms. Just as we discuss a country’s balance of payments with foreign countries, there is also a biophysical balance of payments, where the relationship between the country’s import and export of resources is calculated. Although there is a reasonable balance regarding the total trade between the EU as a whole and the rest of the world, the EU has a major deficit regarding the biophysical balance of payments: we import far more resources than we export.
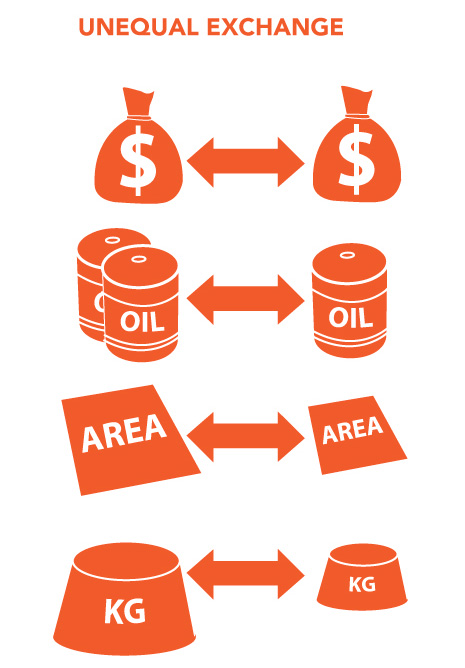
The increasing awareness of the biophysical aspects of international trade has led to a new perspective on an old discussion of unequal exchange between countries. When countries exchange two products that have the same price, it appears to be a straight exchange, but at the same time the exchange can be unequal if the goods are compared according to a different measure. Back in the 1970s, the alternative measure was work hours. The concept of unequal exchange was used to describe the fact that export products from developing countries often required many more work hours to produce than the work hours necessary to produce the goods the developing countries imported from the industrialised countries. This perspective is now supplemented by the fact that there may be unequal exchanges in biophysical terms: In the figure below, the exchange is equal in terms of money, but many developing countries are in a situation where their export products are produced using many more resources (such as energy, materials, biomass, water) than the goods they import. The trade can, thus, undermine the country’s environment and future production potential, especially if the imports are not properly managed (for more information, see the theme, Driving forces, under the section, Trade and globalisation). However, it is not possible to say that all developing countries are in the same situation, while all industrialised countries are in the opposite situation. For example, Australia is a major exporter of resources.
In a world where economic development encounters biophysical limits, governments at the national level have a twofold responsibility. It is important to improve the efficiency of resource use and to adapt the production systems so that they can function with fewer resources. At the same time, it is equally important to limit the total consumption of resources appropriated by the population whether it is linked to domestic or foreign production. Denmark’s position in relation to this twofold responsibility is ambiguous: On the one hand, we are doing better than many other countries regarding the transition of the energy system (and less well for other provision systems). On the other hand, our total resource consumption per person is higher than in most countries. If we are to accept our share of the responsibility, it is important to formulate goals for both production and consumption. So far, it has been difficult to get consumption on the agenda.